
Currently the scientific and R&D communities are continuously talking about data and dataset collection and reuse. Core to these aspects is archiving and preserving this content.
Sharing data is key for many reasons:
- Discoving new science
- Re-producing results
- Verifying research
- Evidence based decision making
- Establishing trust
The projects related with OPF are no exception to the common pattern of producing a lot of data in the course of their research and for this reason it was decided that, wherever possible, this data should be shared.
More than just sharing of data, which typically leads to the exposing of un-curated mess, data should be curated and shared as open linked data for easy re-use.
Important Bit
This does not mean that all data used in the project will be exposed. Neither does it mean that those using the data have to use it as open linked data from the start.
Much like publishing a paper in a journal, not all your draft versions are submitted, and these are certainly not submitted at the note type formats that may be used during the creating of the final PDF that gets published.
The same applies to data.
That which is exposed, should be curated so that it is understandable, discoverable and usable
Usability
This post focusses on curating usable data meaning:
- All the data can be downloaded
- All the data can be loaded by common tools
- All the data can be used in one system
This is the point at which we come back to packaging. We can publish some form of linked data format (.e.g RDF/XML, nTriples, Turtle etc) but which one do you choose and why?
Surprisingly the decision comes down to that of optimum file size, much like video and various other big data formats. Unlike video, which is a streamed format, linked data systems demand the ability to be able to load an entire named graph for processing. So how big should a named-graph be?
Interlude: A named-graph is the equivalent of a document and can contain data/information about many many things (or just one).
While it might be convienient to assign one named-graph per “thing” being described, large datasets will require the trasfer and loading time for very large numbers of files, not optimum. Conversly putting all “things” in one named-graph will lead to one very large file that will take equally long to parse and may fail to transfer.
During my trials with transfering and loading RDF data into an LDS3 system backed by 4store I carried out a number of experiments with named-graphs to find the optimum file size vs number of triples for transfer in, interpretation there-of and transfer out of such systems.
The figure below compares triples per file vs total parse time. So there are a total of 21,000 triples in this test being injested into the LDS3 system, being parsed, annotated and then injested into 4store.
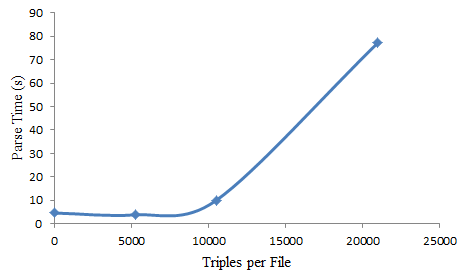
When all 21,000 triples are in one named-graph, total parsed and import time is around 80 seconds, meaning that to import 50million triples (the total size of the dataset) would take 4 days. Leaving each “thing” in it’s own named-graph file means it is a lot quicker to import all the data. However with 2000 files for 21,000 triples, 50 million triples would be contained in nearly 5 million files. That’s a lot of disk iNodes!
From the graph we can see that putting between 5000 and 7000 triples in each named-graph actually results in the lowest total parse time and a much smaller number of files… the best combination.
So when handling RDF data, use RDF XML or N3 (due to file size) and put arround 5,000 triples in each named-graph, aggregating or splitting descriptions of “things” as necessary.

