
After we found out about the fdrawcmd and the characteristics of the Nashua and its track 0, we hoped to reproduce it on the relevant disks. Unfortunately no success here. We had to rule out possible problems like:
- The disks were not formatted at all (because of being backup disks – at least some labels imply this – and many people never check if their backup worked until they actually need it).
- The disks might have been improperly stored before they were transferred into the university archive, thus losing most of the magnetic charge
- The drive simply cannot interpret the actual recording
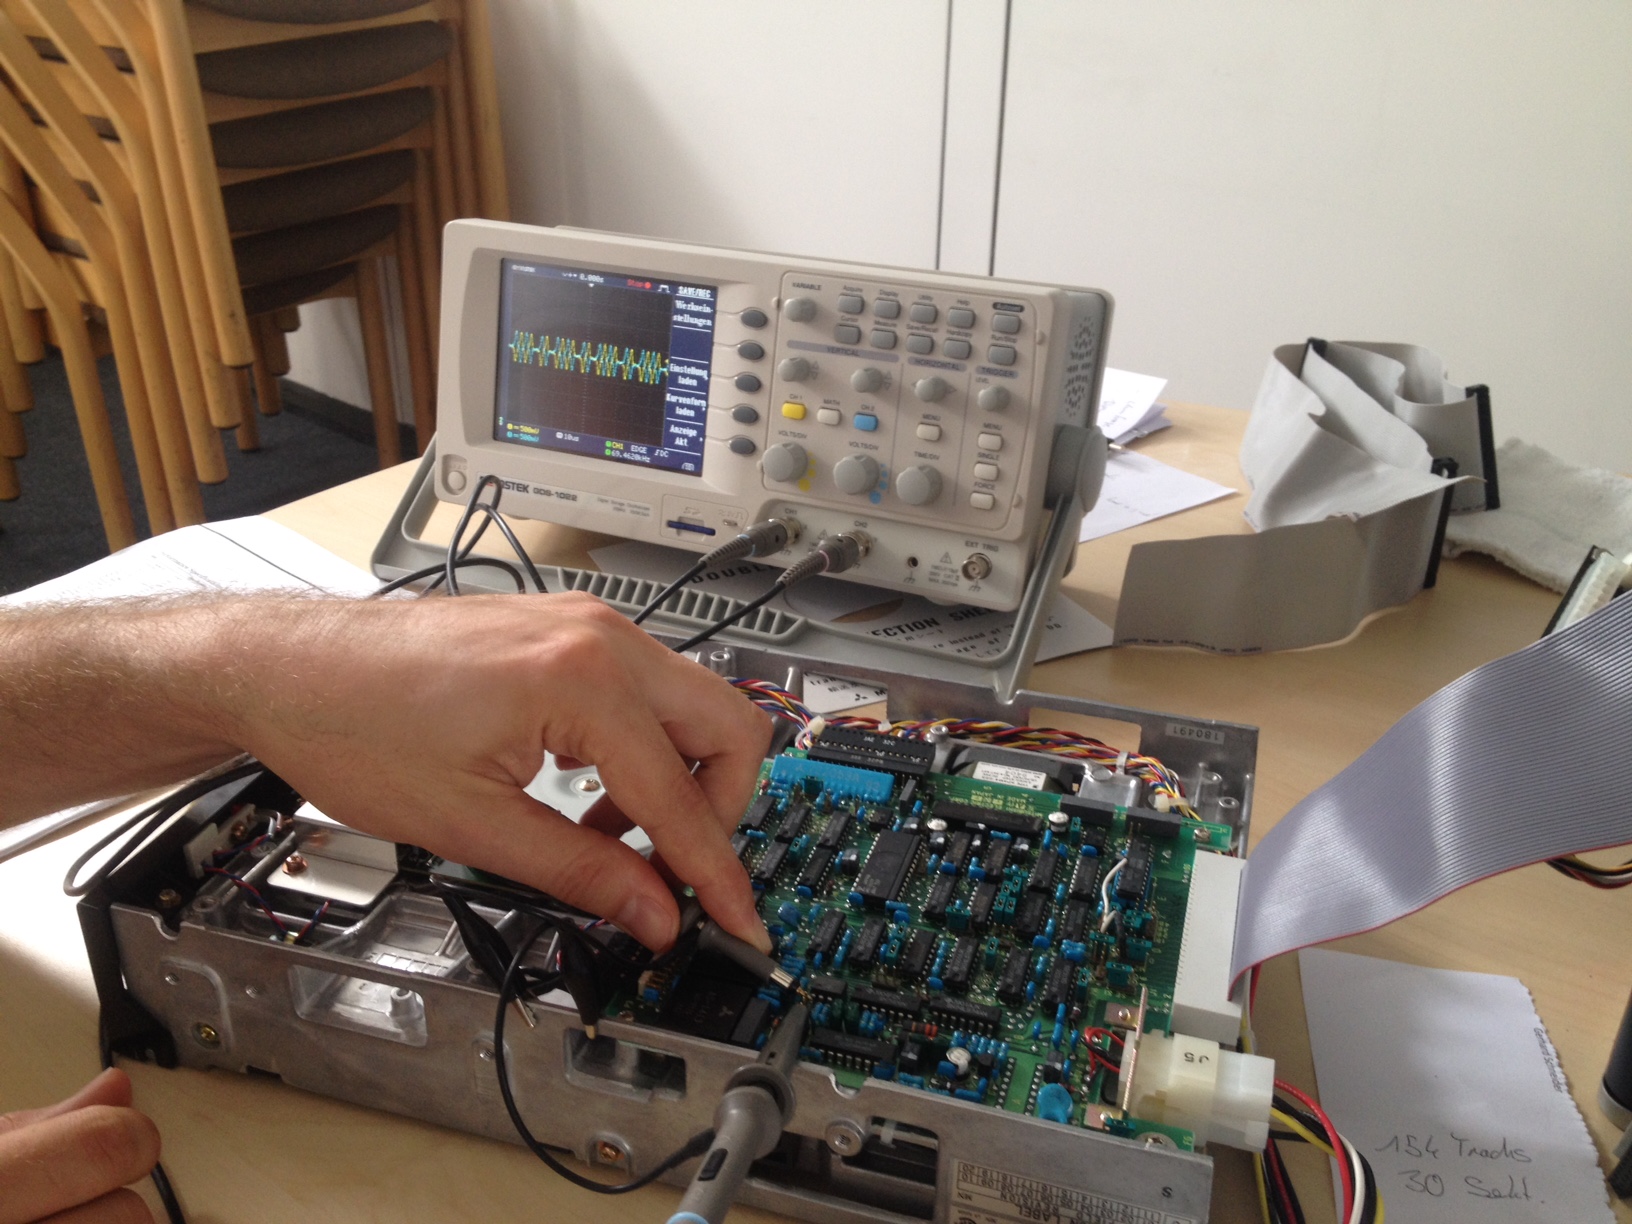
In parallel we are still trying to get in contact with people who either have old hardware running, some 8” disks to spare or deeper background knowledge to help us to better understand the problem and verify our hardware setup. In the meantime we are trying to get down to the lowest layer – the physical readings produced by the drive before interpretation and digitisation takes place. We hope to identify if the disks contains any recorded information at all using an oscilloscope connected to the analogue amplifier after the magnetic reading head.
Using an oscilloscope
Fortunately, a colleague owns such an electronic oscilloscope and helped us with the experiment. The challenge here is what to expect. The rotational speed of the floppy is rather slow compared to modern equipment and the recording density is very low. Even with just 26 sectors of 128 Byte size, a relevant number of changes in the magnetic flux are required to represent the data. We hope that we can at least distinguish between an unformatted disk (or demagnetized disk because of bit rot) and a disk containing data, white noise in the first case and some visible, repeated changes in the second.
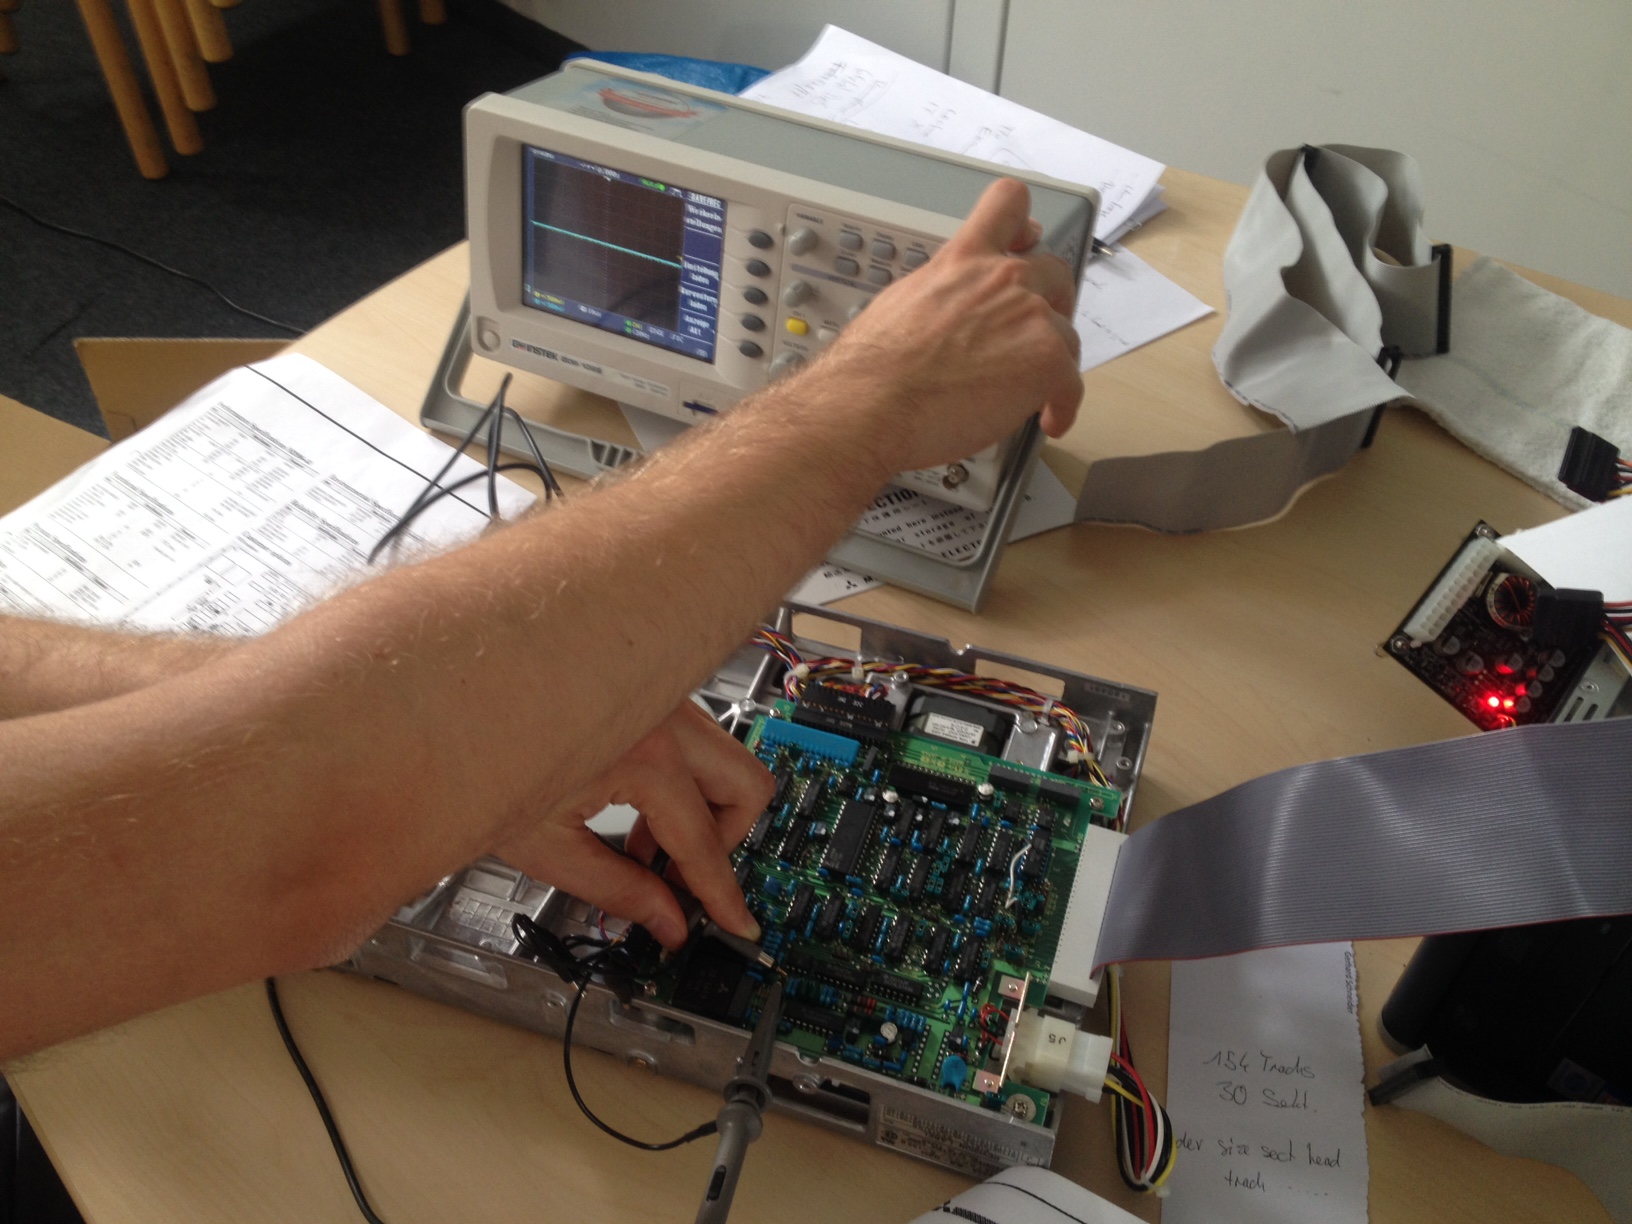
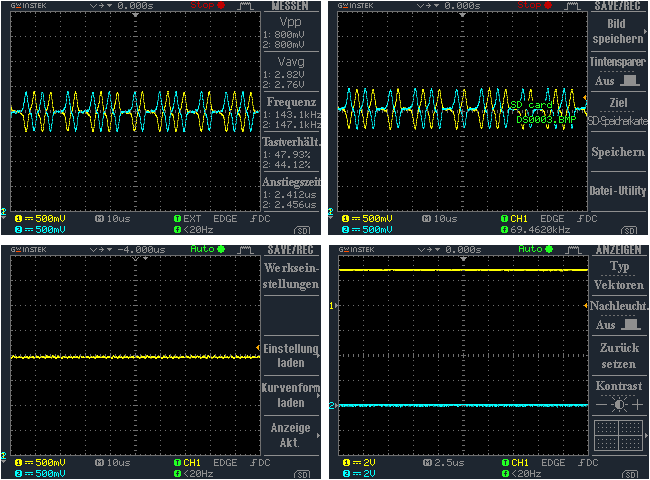
The GW Instek GDS-1022 oscilloscope was connected to the disk drive at AD3 and AD4 on the read circuit. The signal was set to normal level 2.8V on TP-AD3 and 2.75V on TP-AD4. Signal peaks for both channels were 800Vpp.
To trigger readings the low level program fdrawcmd mentioned in the previous blog post was run with different options. We were hoping to see differences when trying the different floppy disks.
Low level readings
In a first run we focused on track 0 and started with the Nashua disk using the fdrawcmd in the setting which produced visible pattern of different frequencies on the oscilloscope. In further rounds we looked for similar patterns on track 0 of the other disks. The picture we got was quite different and looking more like white noise compared to the measurements on the Nashua.
Changing to higher track number produced for both classes of disks pattern which looked different though (compared to the Nashua). Differences between the two classes of disks were definitely visible. This could explain why we were not able to read anything with the methods we were applying up to now.
Preliminary conclusion
The oscilloscope setup we were using had a couple of limitations to the purpose of data interpretation. We were unable to store longer sequences of signal readings but could just freeze the content of the screen. For further stream interpretation a logic analyzer would be required, like e.g. a Bitscope Micro with a software like DSO Data Recorder. Finally, the reading of the disks does not implies that they are completely empty. So we can hope to find something meaningful with more advanced approaches. They should include the Kryoflux device which is created to follow a very low level approach and circumvent most of the floppy disk controller logic.
