
The experiments and floppy disk imaging in Berlin left us pretty optimistic, that our hardware setup for the recovery task, especially the Mitsubishi floppy drive is working properly. We got a stream image of every disk that we can analyze further. Of course we hoped that we would get results by just running the Kryoflux software suite which contains stream analyzers for a wide range of different recording mechanisms (like FM, MFM, RLL for a variety of systems). It still unclear on which system the floppies were actually written. After failing the naive approaches and “interpreting” the oscilloscope readings we ruled out some more standard formats, like the IBMs. In the meantime we tried to get in touch with colleagues who have had experience with the assumed HP systems and read up on the HP9895A drive from the resources at the HP Computer Museum and The HP 9845 Project. While these sites have a wealth of information, documentation of the M2FM format is missing.
So, we got stuck with the images. The Kryoflux stream format just records the changes in the magnetic flux of a given track with timing information and cannot reveal any bits directly. Fortunately, we talked about our project to a University of Freiburg colleague who has extensive background in electrical engineering and is a veteran in low level device matters. He created a small Python script to reproduce the recording patterns to be analyzed and visualized in a logic analyzer software. This is the logical step after having just the live stream from the oscilloscope screen.
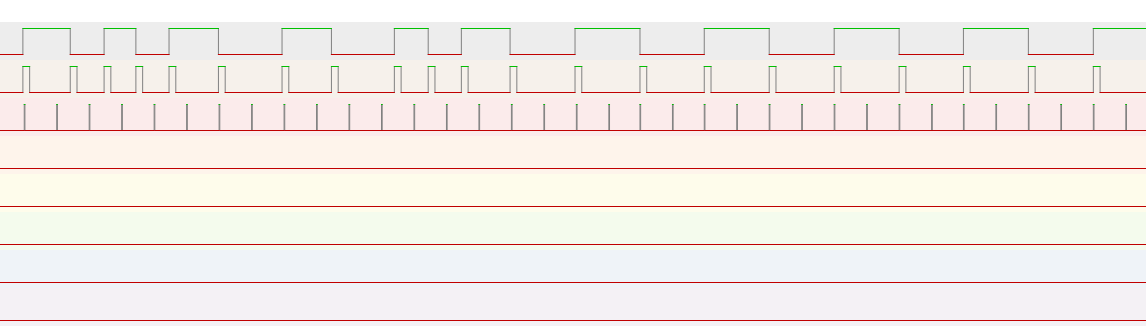
This step was really helpful as we were now able to surf along the stream of each track. It reveals a couple of interesting things:
- After the first brief look the colleague suggested that the recording format looks like plain FM (and not M2FM or MFM as we expected to see).
- The low level format of the system produces clearly visible (synchronization?) patterns in regular distances (one followed by a short block of data the next one followed by a long one). These patterns are visible for every track.
- We presume that the short one is a kind of an information header to the sector(?) that follows and presumably contains the actual data.
Counting the zeros (easier to count, especially in an empty sector) in the graphical representation we estimated a sector size of 128 Byte. This contradicts the specs for the HP drive which have 256 Byte sectors. - Each information block seems to contain information (a couple of non-zeros) which is different for each. This information seems to be created during the low level formating.
- Some data blocks contain information (significant number of non-zeros).
- If the data block contains information, it was presumably put there later (after the low level formating). There are tiny distortions visible at the end of the information block. It ve is nearly impossible to perfectly sync with the original recording. This creates tiny distortions which are clearly visible (in the cases evaluated). They are an additional indicator for data written.
The colleague did a couple of statistical analyses on the Kryoflux streams. They established the numbers for each length of signals (ground truth). There are clearly visible clusterings and only a few outliers (magnitudes less than the number in clusters). The distortions in sector writing are some of them. Thanks to the great help and input, we got a step farther from the fluxes to the bits.
More scrutiny on clock reproduction
Nevertheless, the next step to actually reproduce data from the stream is to have a proper clock signal. The challenge here is that a binary 1 is a changing phase in the middle of a cycle (and then no additional clock signal is inserted) and otherwise a clock is reproduced from mandatory phase changes of consecutive binary zeros.
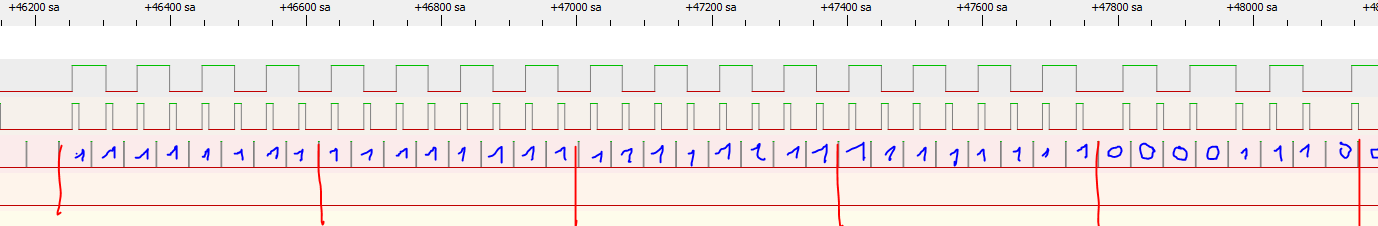
Taking this information into account and introducing a clock marker into the visualization it became clear that some of the visible code violations do not match the FM theory. Additionally, the statistical analysis the colleague did on the phase lengths FM could not completely explain the reproduced pattern. Again the visual analysis was really helpful to spot the oddities. Thus, he changed his opinion to MFM encoding.
Next steps
With all this gathered knowledge it should be possible to create an actual bit stream for each data sector now and read the sector information. The next challenge lies in the reassembling of the bit stream into bytes. Challenges like LSB/MSB, bit ordering come to mind and still lie ahead.

