This article is the fourth in a series on monitoring ageing file formats. Can you predict which file formats are likely to become obsolete? This project is part of the Dutch Digital Heritage Network Preservation Watch and Preferred Formats program.

Original author: Rein van ‘t Veer
In mid-2022, the Preservation Watch working group launched an open call for research on monitoring file formats and their life cycle. Its aim is to investigate the predictability of ageing file formats. In October 2022, Rein van ‘t Veer started working on this project as an author and “data scientist”.
As part of the Royal Netherlands Academy of Arts and Sciences (KNAW), the Data Archiving and Networked Services (DANS) organisation has an important task: archiving research data, particularly in the field of the Humanities. For many years it has been the primary archiving platform for Dutch archaeology: the deposit of (processed) research data from archaeological fieldwork is even a legal obligation. DANS therefore plays an invaluable role for Dutch cultural heritage.
As a recipient of data from many different organisations, the DANS digital archive contains a wide variety of file formats – a good use case for analysis in the context of the project on monitoring file formats at Dutch archives. We briefly discuss the data used and the method for collecting it, and then discuss a selection of supplied file formats that we can designate as decreasing in popularity. As in the previous analyses, we look at the applicability of the Bass model for the selected file formats, this time we test a few cumulative graphs and we look a little more at noise in the initial phase of deliveries. Special thanks go to Valentijn Gilissen (DANS) and Sam Alloing (KB, NL National Library) for their contributions to the article.
Data
An important part of the attention for the analysis of the DANS data has been devoted to collecting and filtering it. DANS switched to a Dataverse repository some time ago. One of the advantages of this platform is that the originally supplied file names, and therefore a good part of the file formats, can be retrieved from the system. For DANS this mainly concerns archaeology data, with the accompanying Data Station Archaeology.
Filtering this data is important: many datasets are available in two versions: a “migrated” version from the previous system called EASY and a version in preferred formats to which the original files have been converted. The number of datasets that have not yet been migrated is about 3 thousand out of 120 thousand – a loss of roughly 3%. This loss mainly consists of large data sets. The migration to the Archaeology Datastation has not yet been completed; larger datasets have not yet been transferred, as the best way to deal with larger volumes in the Datastation environment is still being worked out. Nevertheless, we can state that the datasets that have been included are representative of the total. The missing datasets will boost the numbers, but not the trends and proportions, except probably that the numbers of .JPG files will further emphasise the dominance of this format.
For the purposes of this analysis, we only look at datasets where we have a version 1.0 with originally supplied file names. There is often a version 2.0: a curated version that, by means of a conversion and migration strategy, should protect against the risk of certain file formats becoming obsolete, which DANS has always seen as a risk. As with the other analyses carried out in the context of this project, these files are not looked at, but we only look at the available metadata of the thousands of available files. We use a three-stage rocket for this. The source code for retrieving the data and aggregating it, plus the analysis is open source available.
First, the data retrieval. We go through all the results of the general index page where all available datasets in the Archaeology Datastation are listed. There we extract the Digital Object Identifiers (DOIs) from the concise description, from which we request the general metadata. We filter out in advance the datasets which were migrated from EASY, and datasets that can tell us the original filenames. The complete version metadata of each dataset available in the Archaeology Datastation is written to a file, with the JSON metadata for a dataset on each line. To go through the more than 120,000 datasets in this way, the script takes just over a day, resulting in a file of 2.4 Gigabyte.
Metadata dates
The second stage is aggregating this “raw” data. We extract the file types and production date for the version 1.0 of each dataset, which we aggregate together into a new JSON file, grouped by file type and month. Several date fields are linked to each deposited dataset in the Archaeology Datastation, each of which plays a different role in the life cycle of a dataset. The production date gives the date on which the dataset was completed (previously in EASY the Dublin Core field “date created”). The individual files may have been created before, of course, but this is when they were collected and put together. The moment the dataset is deposited with DANS (the deposit date) can in principle be much later. Then the dataset is curated and published by DANS (the publication date), which again can be much later, depending on the workload and the availability of the data managers at DANS who can publish the dataset. The production date of the first, original versions is therefore the most logical and reliable date to look at trends in the use and occurrence of certain formats.
Data set versions
We initially determined that only datasets with a 1.0 version plus a version number higher than this would be eligible, but this resulted in so much cutting loss that no more than roughly one-tenth of the datasets were still eligible. In order to do an analysis that is representative and thus does justice to the diversity in the data, we have therefore dropped this criterion. The filters resulted in a selection of more than 117,000 datasets, for a total of more than 1.3 million files in 86 different file types, an average of roughly eleven files per dataset. We ignore the data before 1997: the “noise” from this period made it very difficult if not impossible to “fit” the Bass models to the data. By far the most commonly deposited file types are, sorted in descending order:
- JPEG (680 thousand),
- XML (316 thousand),
- PDF (78 thousand),
- CSV (33 thousand),
- DBase DBF (18 thousand),
- TIFF (16 thousand),
- MapInfo TAB (14 thousand)
We analyse the file formats for which we can collect at least 10 quarters of counts, of which we are left with the file types that saw a reduction in filings over the past two years. This still leaves us with dozens of the 272 file types with at least 2 registered file deposits, too many to cover here. We choose a number of notable and common file types.
Before we do this, we first look at the totals in the files offered over the past few years in a general sense. Since Dutch archaeology is highly sensitive to economic cycles, it is important to know how supplies fluctuate. This gives us a more complete picture when we analyse reduced use of a particular format: is it consistent with overall trends?
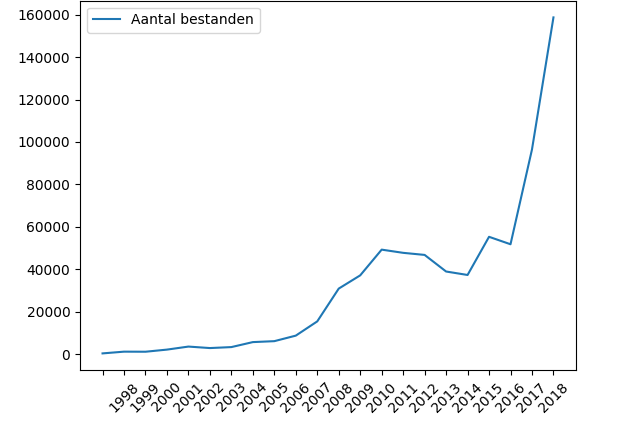
A number of things can be read from the graph. Firstly, there is a start-up phase in which relatively few files were deposited, until 2006. This was followed by a kind of plateau phase in which a slight dip can be seen at the time of the economic crisis around 2012-2013. Followed with a huge increase in deliveries in the period from 2016. The period 2017-2019 also saw the emergence of the ArcheoDepot as a formal machine-to-machine delivery route via the Provinces; the use of preferred formats has been coordinated with DANS. 2400 datasets delivered via this route is a significant contribution to the totals in that period – but it does not explain the entire delivery peak at an average of about 11 files per dataset. The period 2020-2022 has not been taken into account due to incomplete censuses. The delivery period for project data from 2020 has not yet expired, so this period distorts the picture.
If we look at the graphs below, we should therefore also look at these totals with a slanted eye. Based on these numbers, all file formats in use are declining. This decrease also has consequences for the linear regression method. We have so far systematically taken a starting point for the linear trend line from the peak moment of use. Now this peak moment is so close to the current year that this method has insufficient data to be usable for training and testing purposes. We therefore omit this method and look at the applicability of the Bass method.
Areas of application for digital files in archaeology
Below we discuss file types in four categories that are common in archaeology. Data in archaeology can roughly be divided into the following functions:
- Visual material: photos of archaeological fieldwork, photos and drawings of finds, or scans of field drawings;
- Text files: reports as an elaboration of field and desk research, daily reports or descriptions of auger data;
- Data(base) files with descriptive data, such as XML files, Microsoft (Access) databases, DBase files. We will not consider CSV files here, as this is one of DANS’ preferred formats for converting tabular data and offering it to data consumers.
- Geodata files: digital map material in the form of Shapefiles, MapInfo TAB files, GeoJSON and geopackage.
Image formats
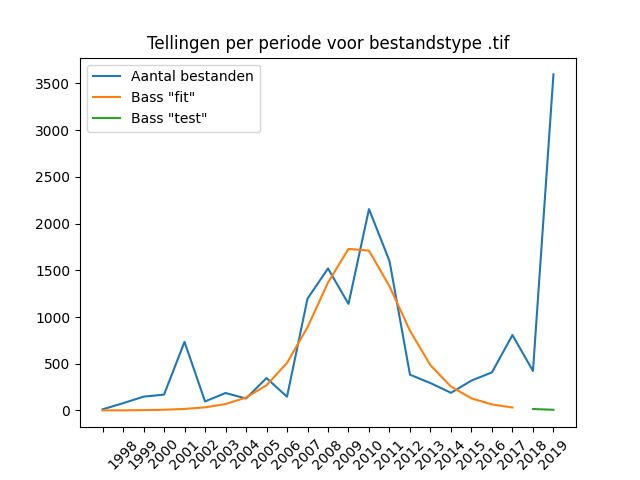
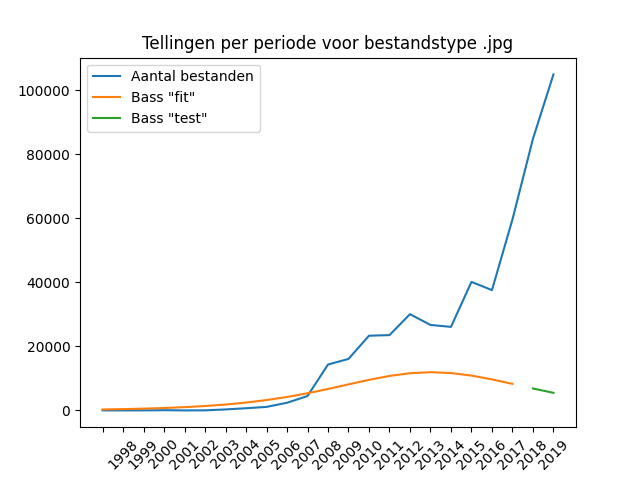
Only JPG and TIFF files appear as image formats in sufficient numbers in the DANS data to be discussed, but together they take up about half of the number of deposited files. A quick look at the data shows that .JPG images are mainly field photos, while TIFF images are scans of object drawings. It is striking that in the case of both file formats the Bass model has difficulty “fitting” the data. It misses the point in both cases. Especially with the .JPG format, the Bass model cannot find a good fit and gets stuck at a flat line that almost follows the y=0 line.
TIFF
JPG
Text formats
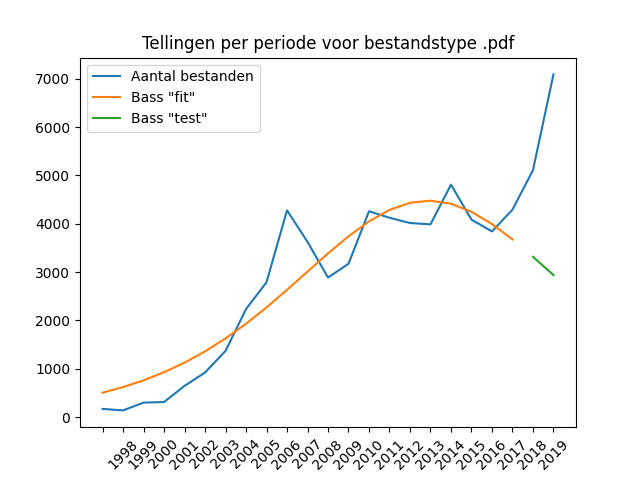
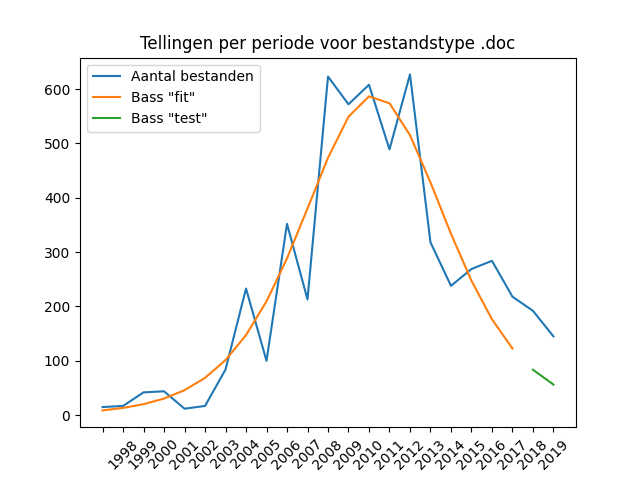
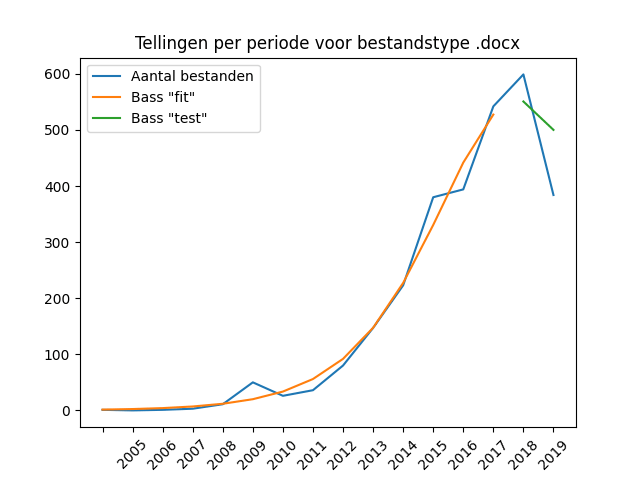
The vast majority of text files are supplied in the form of PDF files, in numbers that do not deviate from the general trend in delivery numbers. This makes sense since it is the primary publishing format for reports. DOC and DOCX files are supplied in roughly equal proportion – these are often daily reports or other preparatory or interim reports. The DOC format does show a clear decline in numbers since 2012 – a decline that cannot be correlated with the general trend across all stocks. This clearly concerns a reduced use of the format and would therefore be a good candidate for making the transition to a replacement format, for example in Open Document Format (ODT).
DOC
DOCX
Geo formats
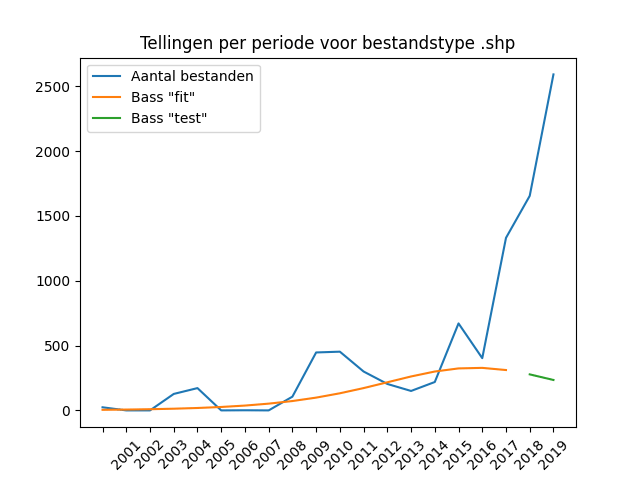
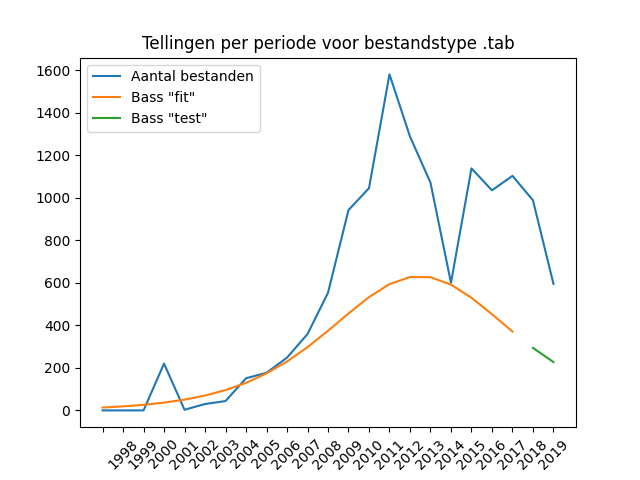
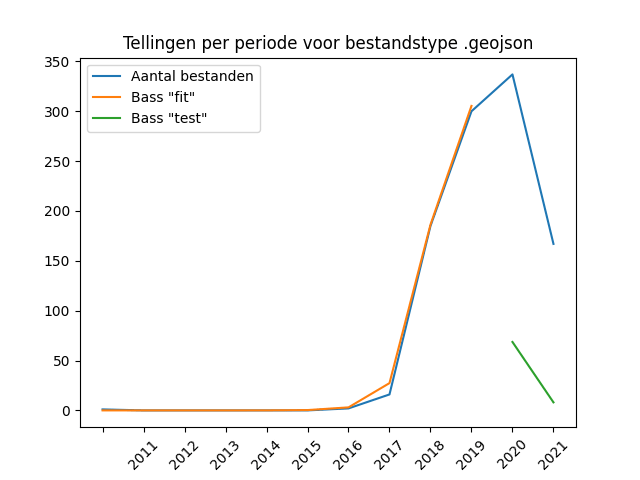
The deliveries to DANS of geo-information are divided into three types of file formats, in descending order of numbers: ESRI Shapefile (SHP), MapInfo TAB, and GeoJSON. The first two formats are proprietary formats owned by major software vendors, the GeoJSON format, on the other hand, is an open specification in JSON standard.
An important emerging standard in the geo world is the “GeoPackage”: an open standard in the form of a single “flat file” sqlite database with the “.gpkg” file extension, containing a specified collection of tables that can contain both vector and raster geodata. Remarkably enough, we see so few files in this format that no graph can be shown – the counts do not exceed 14 supplied files in this format.
ESRI ShapeFile (SHP)
MapInfo TAB
GeoJSON
Tabular data file formats
In archeology, tables are frequently used for standard descriptions of methodical matters (work pits, planes, profiles, measurement points), for archaeological field observations (descriptions of soil traces) and finds (field finds, split finds and material-specific analyses). We’re looking at a few tabular formats that are (semi) structured – in spreadsheets and databases.
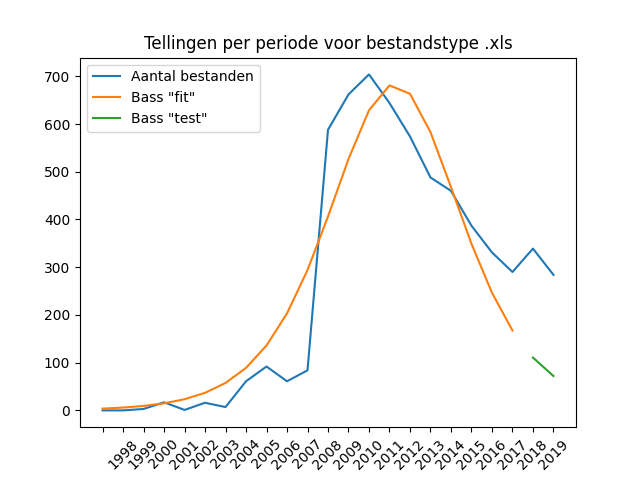
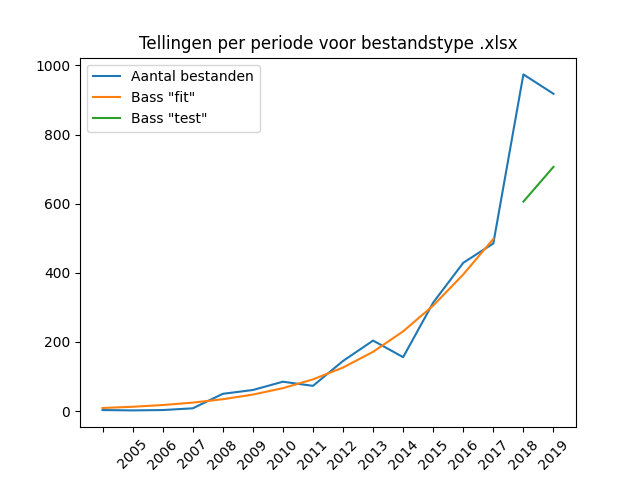
Although spreadsheet formats such as XLS and XLSX are much more difficult to check for quality and integrity of references between tables, these formats continue to be popular, more so than better structured formats such as databases. The spreadsheets are provided in numbers roughly three times that of the most common database formats, which we discuss below. The XLS format, like the outdated .DOC format, is clearly declining in use – this can be explained by the more modern XLSX format that has been included in the more recent Microsoft Office versions. Although the XLS files are readable, they are hardly produced anymore.
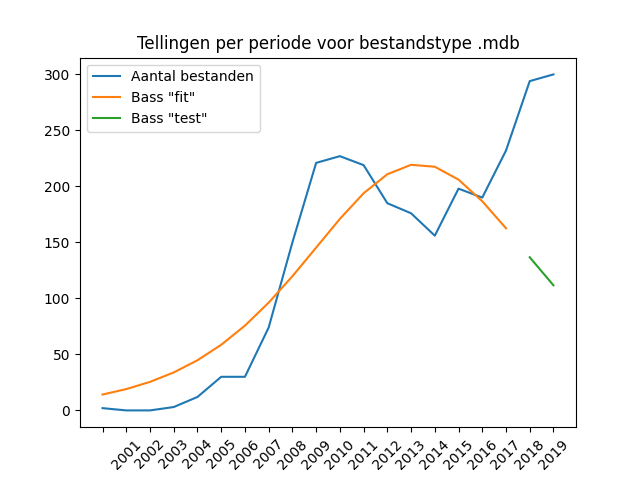
Microsoft has long been making software for using a database in a “flat file” format: a database whose data is contained in a single file. Before MS Office 2007 this was the .MDB format (Microsoft Database format), after that the ACCDB format (Access Database format).
Remarkably enough, the number of supplied ACCDB files is negligibly small. Only 200 files were supplied in the ACCDB follow-up format, despite the fact that this file format has been in use for 15 years (!) now. Surprisingly enough, the Microsoft-produced file formats for databases do not see the transition from obsolete to newer formats, unlike the obsolete DOC and XLS formats. This probably says a lot about the method used in archeology to use a database: from copies of a “base template”. There is little incentive to migrate database applications once a working system has been established. Unless an organisation has started collecting data in a database after switching to MS Access 2007 or later, it is likely that a template of a project database has been set up in .mdb format, which is being copied and reused and further developed. Prior to 2016/2017, hardly any ACCDB files were submitted.
XLS
XLSX
Microsoft Database (MDB)
Microsoft Access database (ACCDB)

Cumulative numbers
Based on the previous analyses, we add a short test here to present a graph of cumulative counts. The total numbers of files supplied, including those from the previous periods. The advantage of this is that such a graph smoothes the teeth in irregular numbers and is therefore a bit kinder to the eye. The Bass model is unchanged: it uses the same three parameters (coefficients) as the “discrete” graph of absolution (non-cumulative) file numbers per period. The chart for TIF files is probably a suitable one, the delivery numbers vary widely.
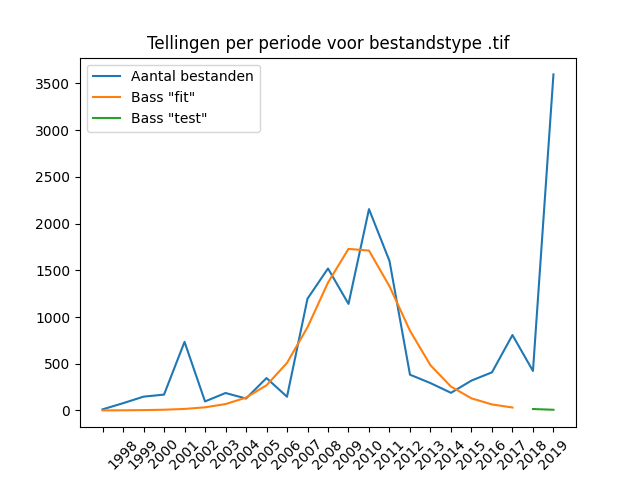
Again the absolute counts per year for TIF:
Versus de cumulatieve tellingen:
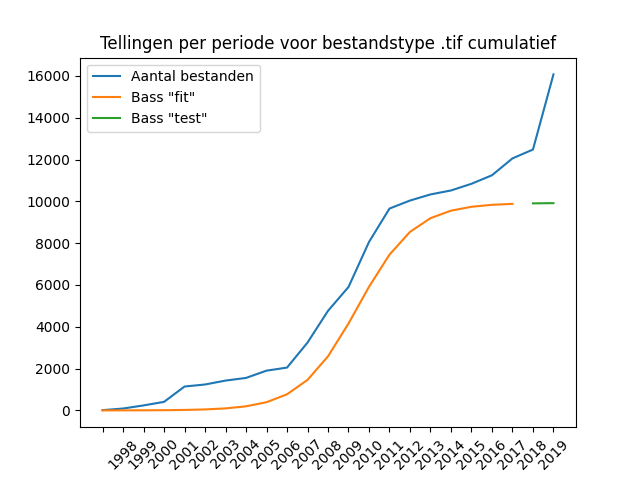
Although the graph looks friendly, it is more difficult to interpret than the graph with absolute counts. The drop in deliveries in the economic crisis of 2012 is easier to see in the absolute numbers than in the sums of the cumulative graph. In both the non-cumulative and cumulative tones, it is clear the difficulty that the Bass model has with the second peak of deliveries in the period 2017-2019.
The “cumulative approach” does not solve situations where the Bass model cannot find a good “fit” with the data – see for example the cumulative Bass graph for the JPEG format, which shows exactly the same picture for the Bass projections.
“Leading noise”
What we hadn’t seen before was that the incorrect “historical” data – PDF files from years before the format was invented – can really mess up the Bass model. This shows that the data had to be properly cleaned before it could be used for the Bass algorithm. The model appears to be unable to handle a start-up phase that contains many low values or zero values. In general, this resulted in graphs with completely flat Bass curves. An example:
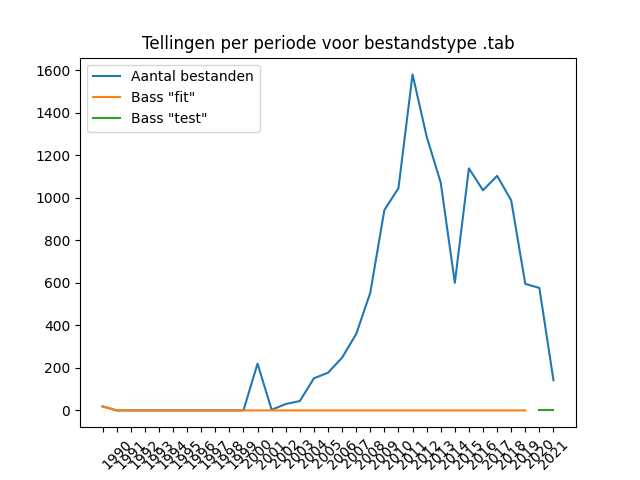
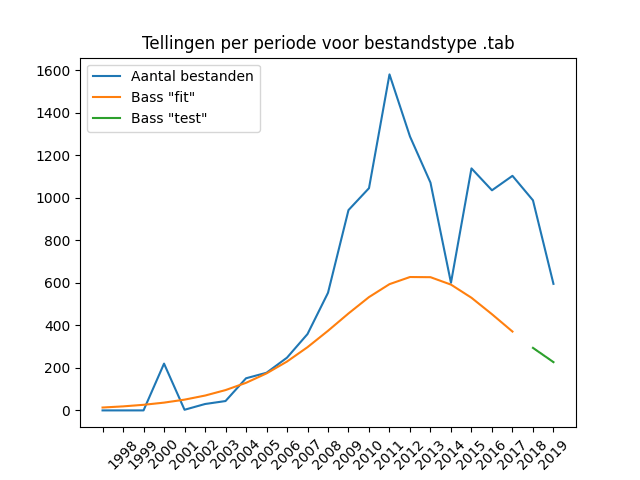
An initial phase with low numbers does not always result in a bad fit. The graph for the JPG format (see above) clearly does, but the one for GeoJSON, remarkably enough, does not. It therefore remains a matter of experimentation. It is impossible to say in advance whether a start-up phase will result in a bad Bass model.
Conclusion
The variety of files supplied to DANS enables a good analysis of the main areas of application of digital data in Dutch archaeology. We have analysed file types for image material, text files, database files and spatial data.
In a number of cases within these file formats it is clear that there have been transitions from older formats to newer ones, especially when it comes to file formats related to the MS Office package. Older Word and Excel files are being superseded by the newer variants, but remarkably this is not the case for the database formats used in MS Access. In the field of geo-information, GeoJSON is on the rise, and the MapInfo .TAB format seems to be clearly declining in use. MapInfo’s position in archaeology is clearly declining. We are not yet seeing the emergence of newer open geo formats such as GeoPackage. The text formats are mainly dominated by .PDF files, whereby we currently have no insight (we do not look into the files in these analyses) into the extent to which the archive subformat PDF/A is involved.
As for the usefulness of the Bass model for the numbers of files in the formats covered, we don’t get much further than a very moderate value of this method. The algorithm finds it difficult to cope with the two major supply peak periods around 2010 and 2019. The economic climate in which Dutch archeology moves along throws a spanner in the works for an algorithm that lacks the expressiveness to deal with this properly.
EDIT: After the initial publication of the blog on LinkedIn, an adjustment was made to the analysis, based on the suggestion of Erwin van der Klooster. We have excluded the stock counts for the period 2020-2022, because the two-year term for the delivery of archaeological files does not yet apply to this. This leads to incomplete counts, hence the correction.
Event
Do you want to learn how to make predictions about the life cycle of file formats in an e-depot?
We will host an in-person workshop in Dutch where you get to work hands-on with your own data. Join us on 5 September, 2023, 13:00-16:00 at KB, National Library of the Netherlands in The Hague. More information.
Previous blogs in the translated series by Rein van ‘t Veer:
blog 2: The Internet as an archive, the Bass model in practice
blog 3: The Netherlands Institute for Sound & Vision
© 2022 CC-BY-SA-4.0 Rein van ‘t Veer/Netwerk Digitaal Erfgoed.


